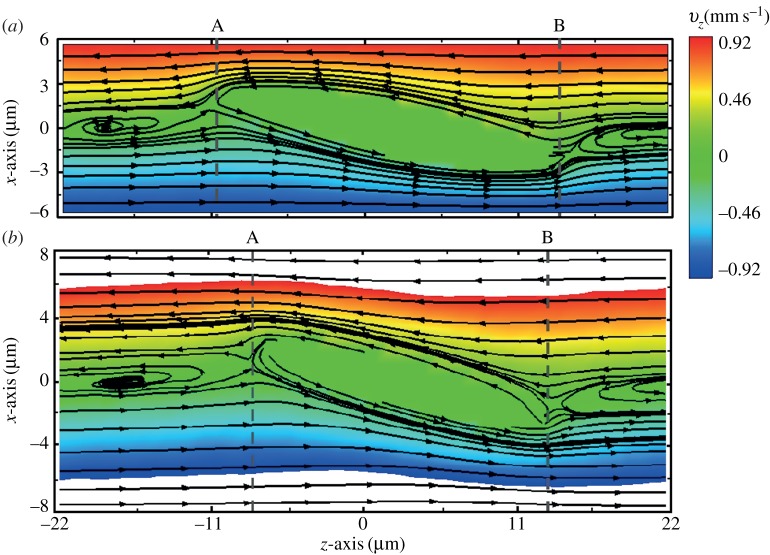
Figure 8.
Flow streamlines and flow contours within an x−z cross-section of the suspending fluid flowing around the RBC for η0=28.9 cP and  at tr=0.67 (a) and 0.22 (b). In the figure, each arrow represents the direction of the fluid flow velocity, and the flow contour of the velocity field is shown with the velocity in the range between −0.92 and 0.92 mm s−1. The middle regions without streamlines indicate the presence of the RBC. The colour contour takes positive and negative values depending on the direction of the velocity of fluid flow. (Online version in colour.)

