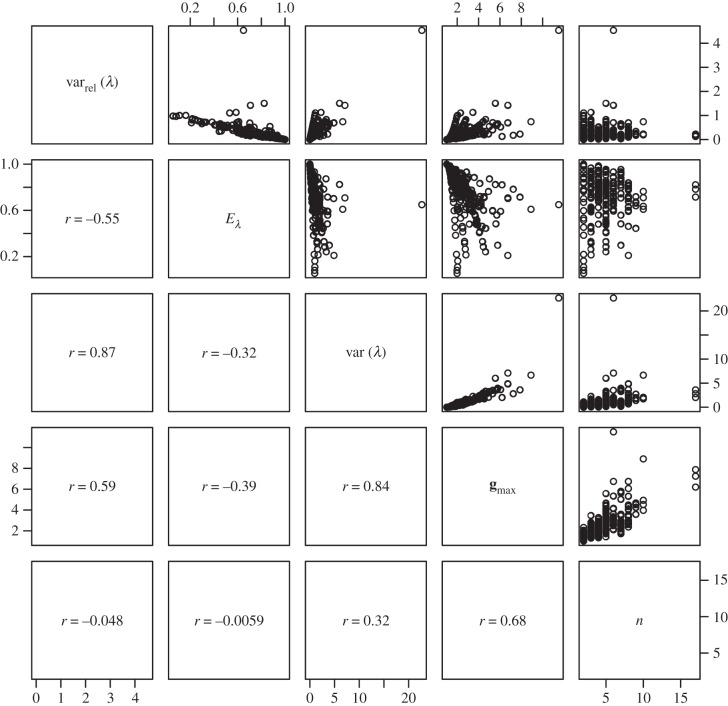
Figure 5.
Pairs plot to illustrate the relationships between measures used to describe the structure of G expressed as correlation matrices. Measures are ‘relative eigenvalue variance’ (varrel(λ)) [49], ‘eigenvalue evenness’ (Eλ) [23], ‘eigenvalue variance’ (var(λ)), [49], the first eigenvalue of G (gmax) and the number of traits included in the matrix (n). Figures in the lower off-diagonal are pairwise correlations between the measures.

