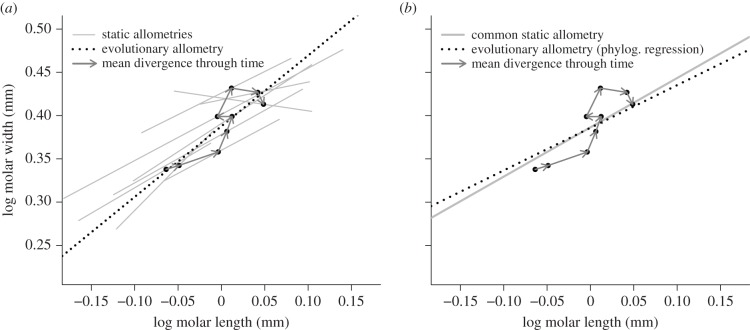
Figure 3.
(a) Bivariate divergence and allometric slopes for the first lower molar (M1) within the M. savini lineage in the Iberian Peninsula. Arrows represent the transitions through time between population means (dark dots). Static allometric slopes for each population (table 1) and the ordinary least-squares evolutionary slope (dotted line, be = 0.81 ± s.e.: 0.18, R2 = 0.74) are also indicated. (b) MCMCglmm allometric estimates (table 2) displayed on the same graph. This illustrates the distribution of the population means around the common static allometric slope (grey) and the comparison to the evolutionary slope estimate (dotted line) accounting for the sampling error and the expected among-population covariance structure.

