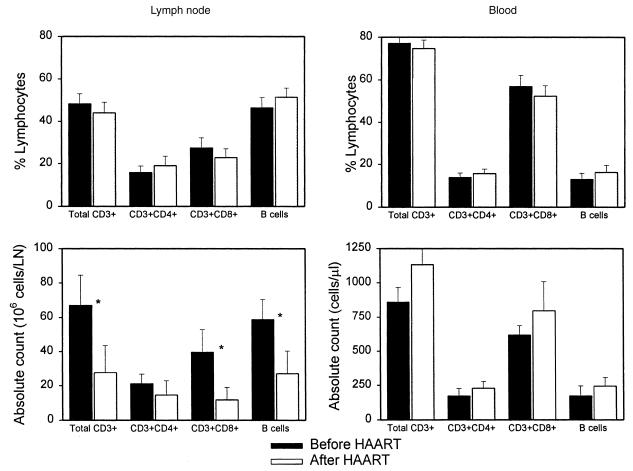
Figure 3.
Comparison of relative frequency (top) and absolute number (bottom) of lymphoid subsets in either lymph node or blood. The dark bars are data from baseline (before HAART), and the light bars are data from 10 weeks after HAART induction. The fall in lymphocytes in the lymph node biopsy (Figure 1) results in a calculated decrease in total T cells, CD8+ T cells, and B cells in the lymph node (*P < 0.05), although the relative fraction of these cells is not significantly changed by HAART (top). Although the increase in blood does not achieve formal statistical significance, a single subject with high initial lymphocyte count that fell after therapy confounds the trend of increased cells in blood.

