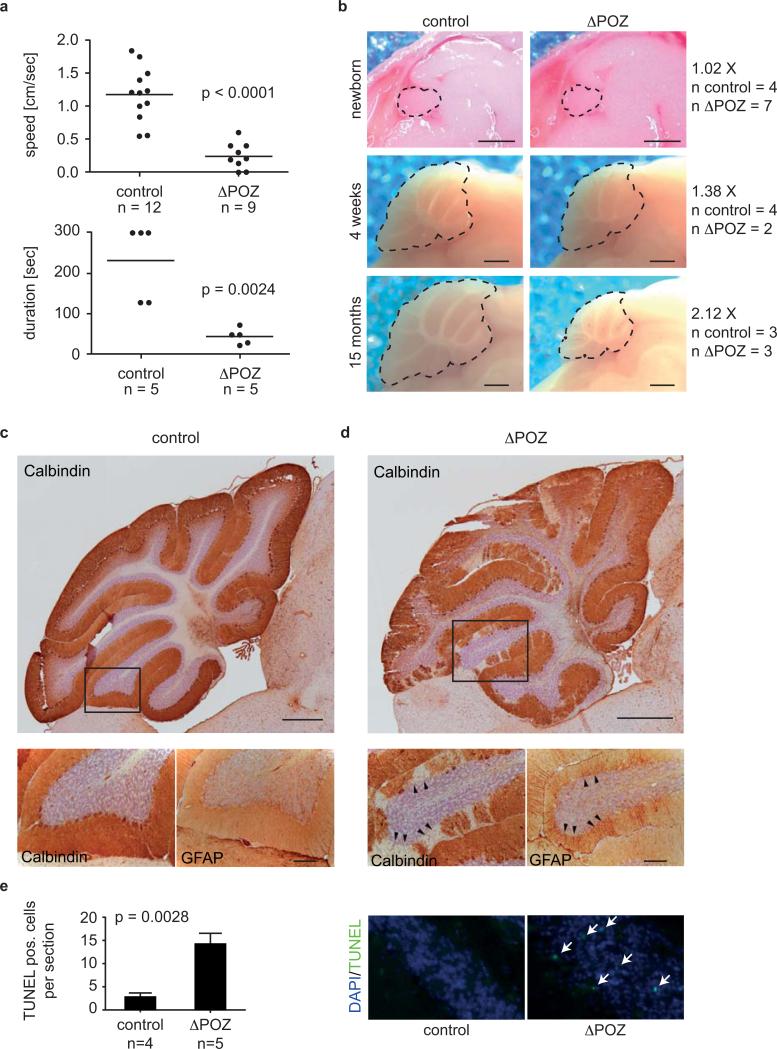
Figure 1. Phenotype of Miz1ΔPOZNes mice.
(a) Miz1ΔPOZNes mice move slowly and lack motor co-ordination. The panel shows the average speed of movement and time on a rotarod (maximum: 300 sec) maintained at constant speed of control and age-matched Miz1ΔPOZNes mice. The average age of mice tested was 16 months. p-values were calculated using an unpaired two-tailed Student's t-test (The number of animals tested is shown below each graph).
(b) Defect of cerebellar growth in Miz1ΔPOZNes mice. The panels show sagittal sections of brains of control and Miz1ΔPOZNes mice at the indicated age. Dotted lines show the circumference of the cerebellum. For each mouse, the cerebellar surface area was determined; numbers show the ratio between control and Miz1ΔPOZNes mice. The number of mice analyzed for each genotype is indicated on the right. Scale bar: 1mm.
(c,d): Histology of the cerebellum. Sections of the cerebellum of 11 month-old control (c) and Miz1ΔPOZNes (d, please note different scale) mice were stained with antibodies directed against calbindin, a marker for Purkinje cells, and GFAP, a marker for Bergman glial cells. Boxes indicate the area of a detail picture in the overviews. GFAP staining is shown for adjacent section (arrowheads: regions of missing Purkinje cells). Scale bar: Upper panels: 500 μm, lower panels: 100 μm.
(e) Enhanced apoptosis in the granular layer of cerebella in Miz1ΔPOZNes mice. The upper panel shows representative TUNEL staining of cerebella of age-matched control and Miz1ΔPOZNes mice. The lower panel shows a quantification of staining observed in four control and five Miz1ΔPOZNes mice. Error bars show standard error of the mean (SEM). p-value was calculated using an unpaired two-tailed Student's t-test.

