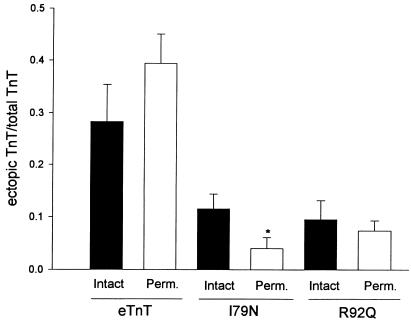
Figure 3.
Comparison of ectopic protein expression in membrane-intact and membrane-permeabilized myocyte samples. Scanning densitometry was performed to determine the ectopic TnT/total TnT ratio. eTnT: n = 9 (intact), n = 11 (permeabilized); I79N: n = 11 (intact), n = 12 (permeabilized); R92Q: n = 7 (intact), n = 13 (permeabilized). Bars represent the mean ± SE. *Significant difference between intact and permeabilized. For each ectopic protein, membrane-intact and membrane-permeabilized data were compared using an unpaired t test. P = 0.23 for eTnT; P = 0.04 for I79N; and P = 0.57 for R92Q.

