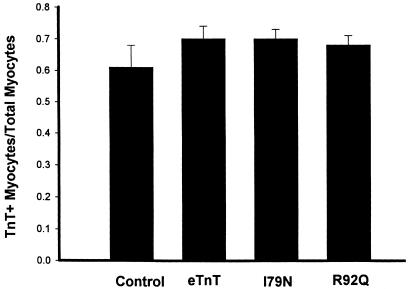
Figure 5.
Summary of scoring of immunofluorescence data for cardiac myocytes following gene transfer. The graph shows the fraction of total rod-shaped myocytes counted that showed a striated pattern of TnT staining (TnT+). Refer to Methods for details on scoring coverslips. Numbers of coverslips examined were as follows: control = 3; eTnT = 7; I79 = 11; and R92Q = 11. Bars represent the mean ± SE.

