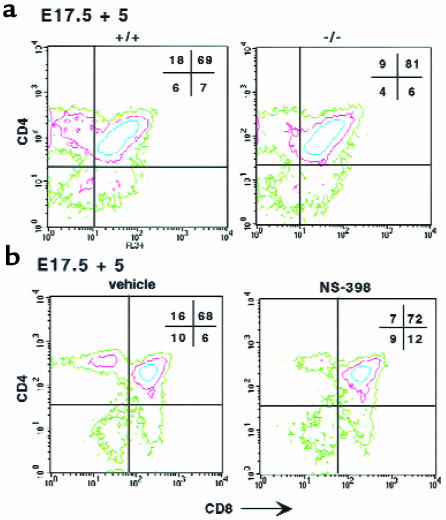
Figure 6.
Flow cytometric analyses of thymocytes from COX-2–/– E17.5 FTOCs and wild-type E17.5 FTOCs in the presence of COX-2 inhibitors. (a) E17.5 thymi were isolated from COX-2–/– embryos (–/–) and control siblings (+/+) and cultured for 5 days. Thymocytes were analyzed for CD4 and CD8 expression by flow cytometry. The contour plots are shown. Percentages are indicated in the corner of each quadrant. (b) The same experiments and analyses were performed in wild-type E17.5 FTOCs in the presence of the selective COX-2 inhibitor NS-398 (40 μM) or vehicle.

