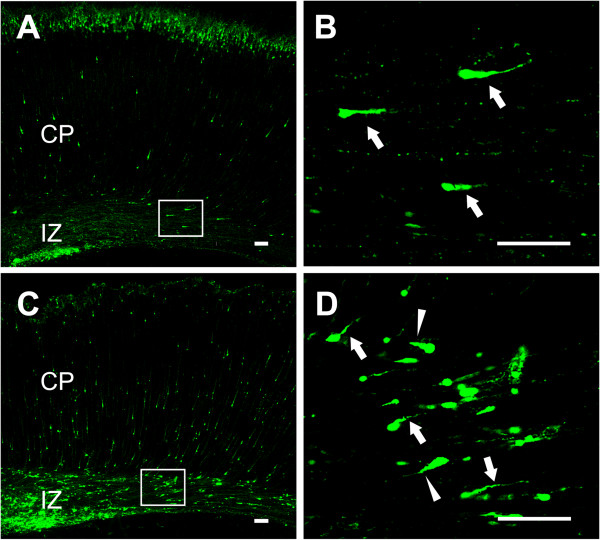
Figure 6.

Misorientation of leading processes of migrating neurons by IL-1R1 down-regulation. Representative images of migrating neurons from P5 cortices electroporated at E16 with control (A) or IL-1R1 siRNA (C). The selected regions in the left panels are shown in high magnification at right (B and D, respectively). Arrows and arrow heads in B and D show migrating neurons with normal or reversed leading processes, respectively. Scale bar, 300 μm in A and C, 100 μm in B and D. E, embryonic day; P, postnatal day.
