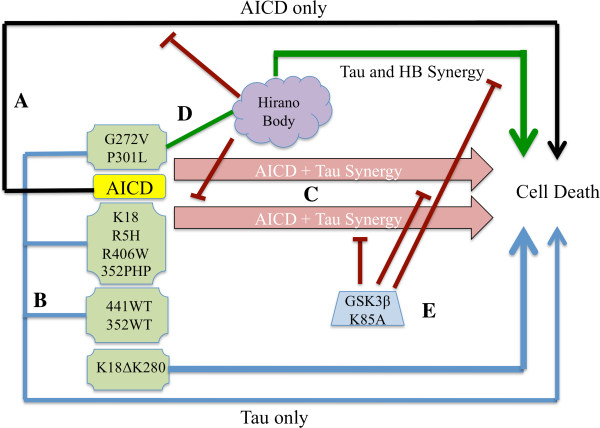
Figure 9.

Model of the interplay between AICD, tau, and model Hirano bodies. A. The black line represents cell death initiated by “AICD only” pathway involving Fe65, Tip60, p53, and caspases (41, 6). B. Blue line represent the modest levels of cell death initiated by “tau only” including K18ΔK280 alone and low levels of cell death from all other tau alone (green boxes). C. The pink arrows represent the synergistic cell death due to AICD and either G272V, P301L, K18, RH5, R406W, or 352PHP tau. 441WT, 352WT, and K18ΔK280 do not synergize with AICD to promote cell death. D. Model Hirano bodies protect against AICD -induced cell death and cell death initiated by AICD and K18, RH5, R406W, or 352PHP tau (red lines). In contrast, model Hirano bodies potentiate AICD- induced cell death in the presence of either P301L or G272V tau (green lines). Model Hirano bodies alone have no impact on K18, R5H, R406W, 352PHP, 441WT, 352WT, or K18ΔK280 tau -induced cell death or have negative consequences. In addition, the synergistic cell death induced by AICD in the presence of G272V or P301L tau is not affected by the presence of model Hirano bodies. E. Expression of the dominant negative GSK3-β (K85A) prevents cell death initiated by synergistic interaction of AICD and tau or model Hirano bodies and G272V or P301L tau (red lines).
