
Figure 3.
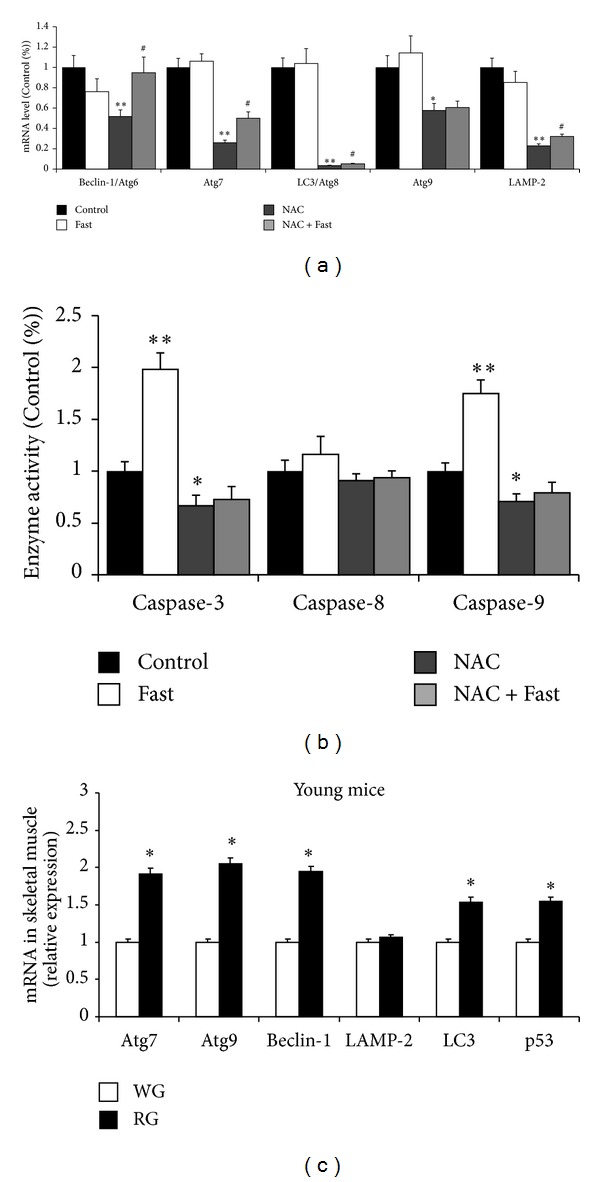
Autophagy-related gene expressions were analyzed by real-time PCR in gastrocnemius muscle. (a) mRNA level of Beclin-1, Atg7, LC3, Atg9, and LAMP2. (b) Caspases 3, 8, and 9 enzyme activity in gastrocnemius muscle. (c) Autophagy-related gene expressions in red gastrocnemius (RG) versus white gastrocnemius (WG). Values are means ± SE (fold differences). *P < 0.05, **P < 0.01 significantly different versus Control, # P < 0.05 significantly different versus NAC.