
Figure 4.
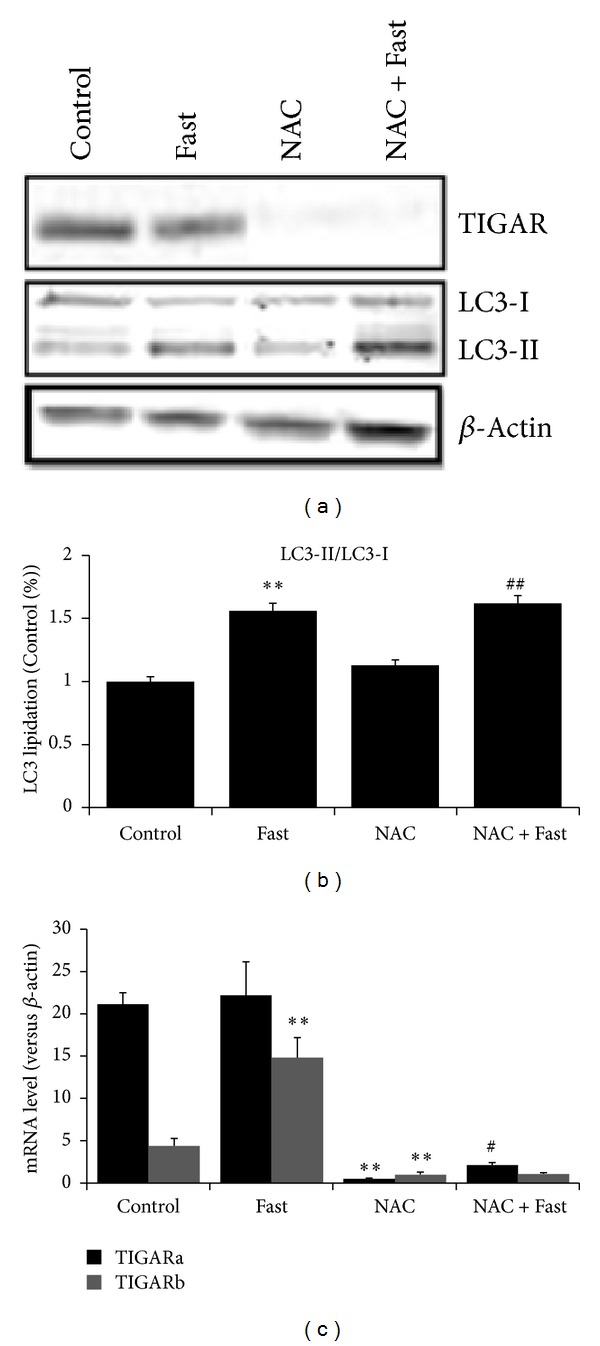
LC3 lipidation and expressions of TIGAR were measured in skeletal muscle after short-term fasting. (a) Representative western blots of LC3, TIGAR. (b) LC3-II/LC3-I ratio. (c) mRNA expression of TIGAR. Values are means ± SE. **P < 0.01 significantly different versus Control, # P < 0.05, ## P < 0.01 significantly different versus NAC.