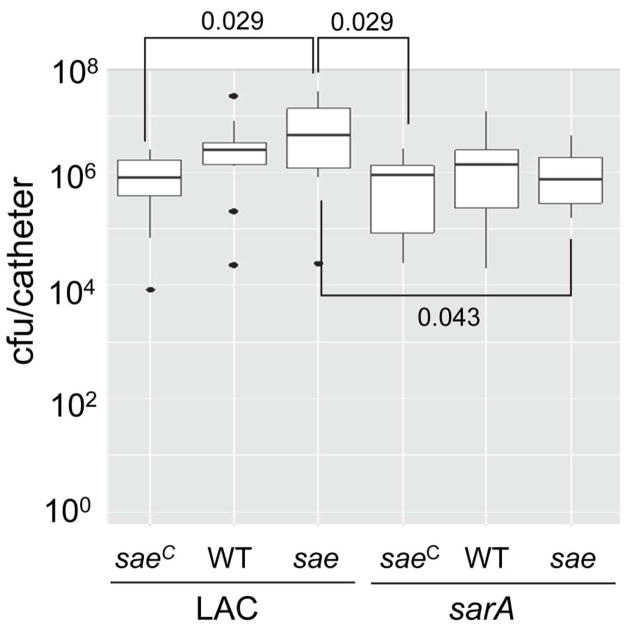
Fig. 10. Impact of saeRS and sarA on biofilm formation in vivo.
Biofilm formation was assessed using a murine model of implant-associated biofilm formation (Weiss et al., 2009). Strain designations are the same as in Fig. 1. Boxes indicate the 25th and 75th percentiles for each group and define the interquartile range (IQR), with the horizontal line indicating the median. Vertical lines define the lowest and highest data points within 1.5 IQR of the lower and higher quartile respectively, with individual dots representing single data points outside this range. Numbers above and within the graph indicate statistical significance between the designated groups.

