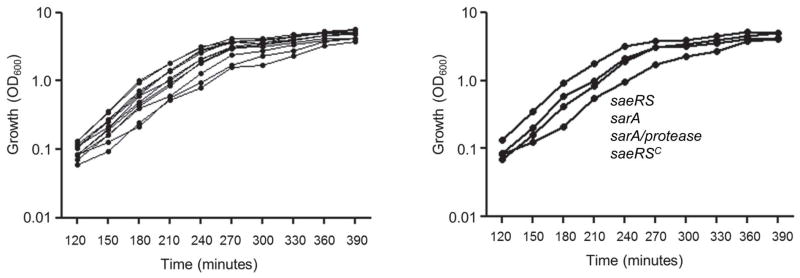
Fig. 11. Impact of saeRS and sarA on growth in vitro.

Growth was assessed in tryptic soy broth based on optical density (OD600) at the indicated time points. The panel on the left illustrates the results observed with all strains included in these studies and is intended only to illustrate that the differences in growth rate and overall yield were similar in all strains. The panel on the right breaks out the growth curves of the indicated strains because these were considered the most relevant in the overall context of this report. The strains are listed vertically to correspond to the order of the growth curves observed with each strain (i.e. the greatest difference observed among all strains was that between the saeRS mutant and its constitutively active variant).
