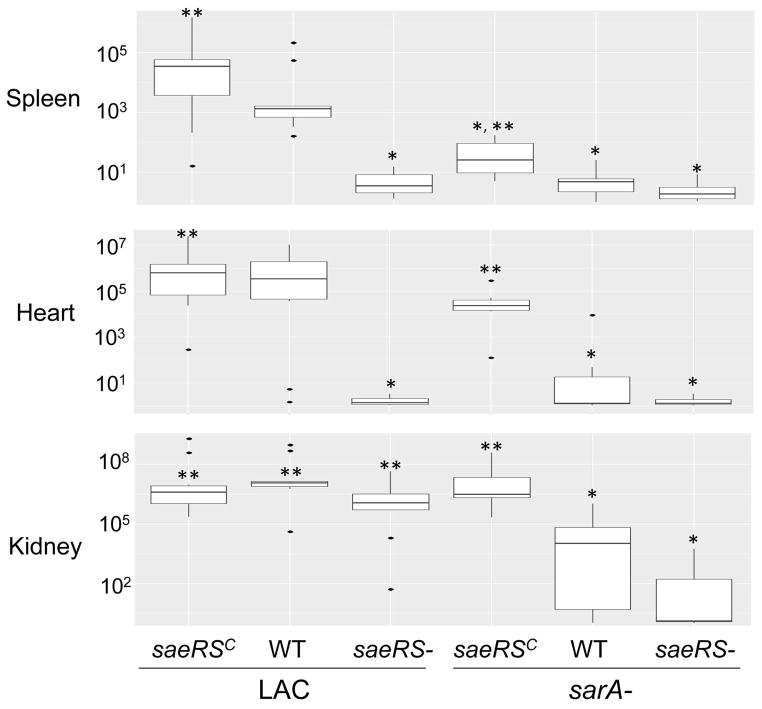
Fig. 6. Impact of saeRS vs. sarA on virulence in a bacteremia model.
Results are shown as colony forming units (cfu) per organ obtained from the indicated tissues 6 days after intravenous injection of the indicated S. aureus strains. As in Fig. 1, for simplicity in labeling, the designation WT in the group underlined on the right indicates results observed with the LAC sarA mutant. Boxes indicate the 25th and 75th percentiles for each group and define the interquartile range (IQR), with the (+) within each box indicating the mean and the horizontal line indicating the median. Vertical lines define the lowest and highest data points within 1.5 IQR of the lower and higher quartile respectively, with individual dots representing single data points outside this range. A single asterisk indicates significance by comparison to the parent strain, while double asterisks indicate significance by comparison to the isogenic sarA mutant.

