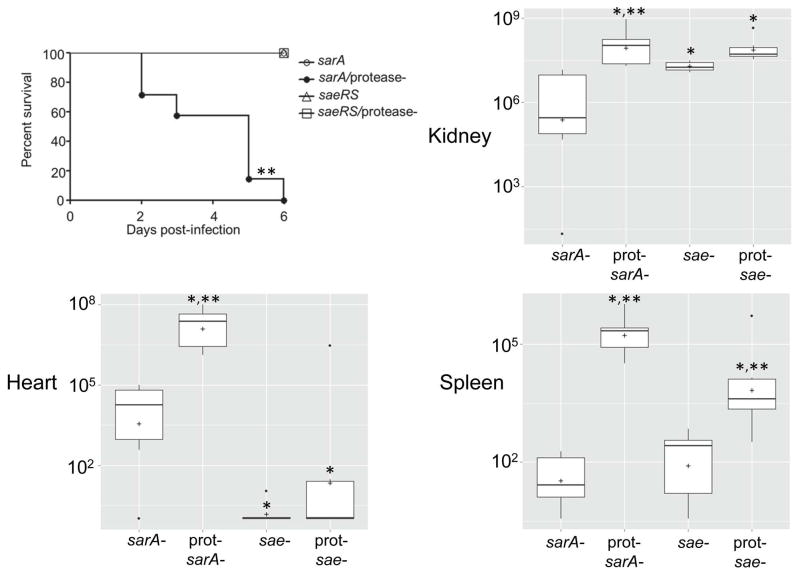
Fig. 8. Impact of protease production on phenotypes of saeRS and sarA mutants.
Upper left illustrates Kaplan-Meirer survival curves of mice infected by tail vein injection of 5 × 10⁷ cfu of the indicated strains. Remaining panels illustrate colony counts obtained from the indicated tissues 6 days after intravenous injection of the indicated S. aureus strains. Boxes indicate the 25th and 75th percentiles for each group and define the interquartile range (IQR), with the horizontal line indicating the median. Vertical lines define the lowest and highest data points within 1.5 IQR of the lower and higher quartile respectively, with individual dots representing single data points outside this range. The asterisk indicates significance by comparison to the sarA mutant. Double asterisks indicate significance of the protease-deficient mutant by comparison to the isogenic protease-positive regulatory mutant.

