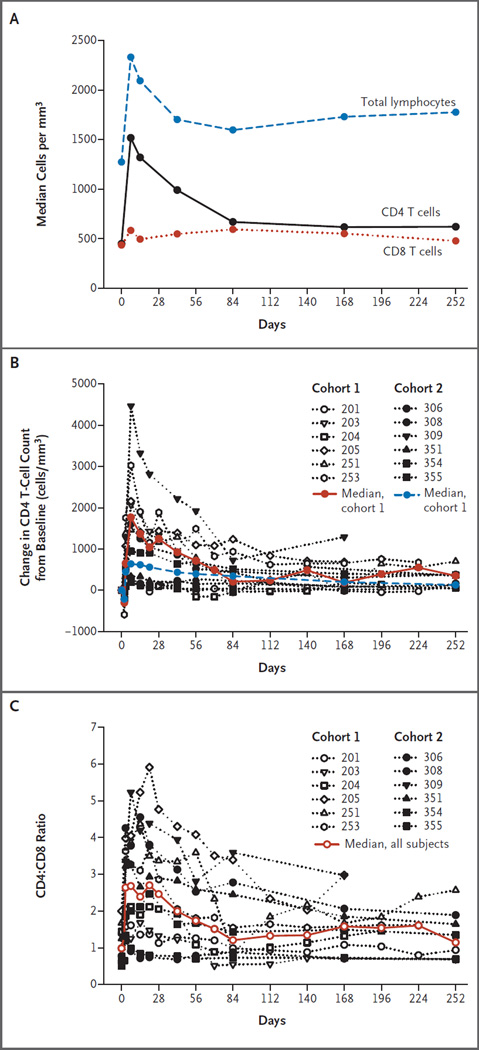
Figure 1. Lymphocyte Values.
In Panel A, median total lymphocyte, CD4 T-cell, and CD8 T-cell values for all study participants are shown (see Fig. S1 in the Supplementary Appendix). The increase in total lymphocyte count is due to an increase in the number of CD4 T cells, since changes in CD8 counts are negligible. In Panel B, the change in CD4 T-cell count from baseline is plotted for all participants, and the median change is plotted for each cohort. In Panel C, the median ratios of CD4 T cells to CD8 T cells are plotted for all participants.

