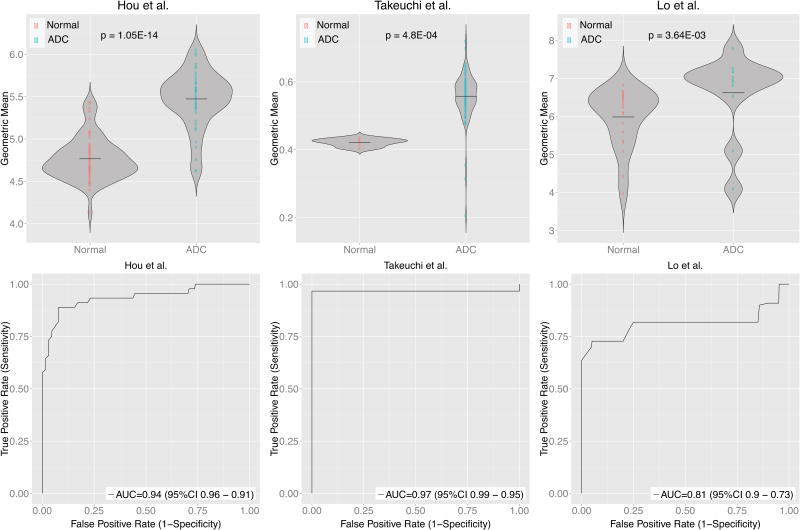
Figure 2.
Eleven genes were significantly over-expressed in three independent ADC gene expression data sets. A. The 11 genes cluster ADC vs normal in three independent ADC data sets. Each column is a sample and each row is the expression level of a gene. The color scale represents the raw Z-score ranging from blue (low expression) to yellow (high expression). Dendrograms above each heatmap correspond to the Pearson correlation-based hierarchical clustering of samples by expression of the 11 genes. B. Swarm plots summarizing the normal and ADC expression values (log2) by geometric mean of the 11-gene signature. C. Performance of a univariate classification model for predicting ADC vs normal based on gene expression of the 11-gene signature across the independent datasets measured by ROC curves. AUC is area under the curve.

