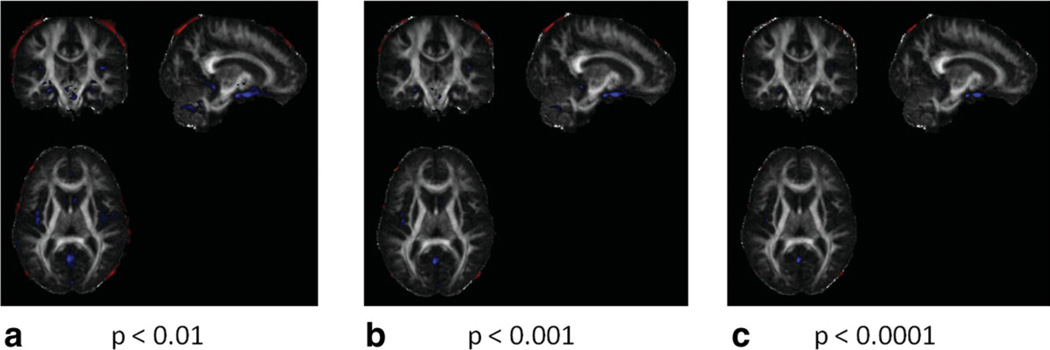
Figure 4.
Comparison of the late registration and early registration methods using SPM. Regions in which FA values of early registration are greater than those of late registration are presented in red and regions in which FA values of early registration are smaller than those of late registration are presented in blue. All FA images were smoothed using a 5 mm kernel before comparison. a: P < 0.01. b: P < 0.001. c: P < 0.0001. [Color figure can be viewed in the online issue, which is available at wileyonlinelibrary.com.]

