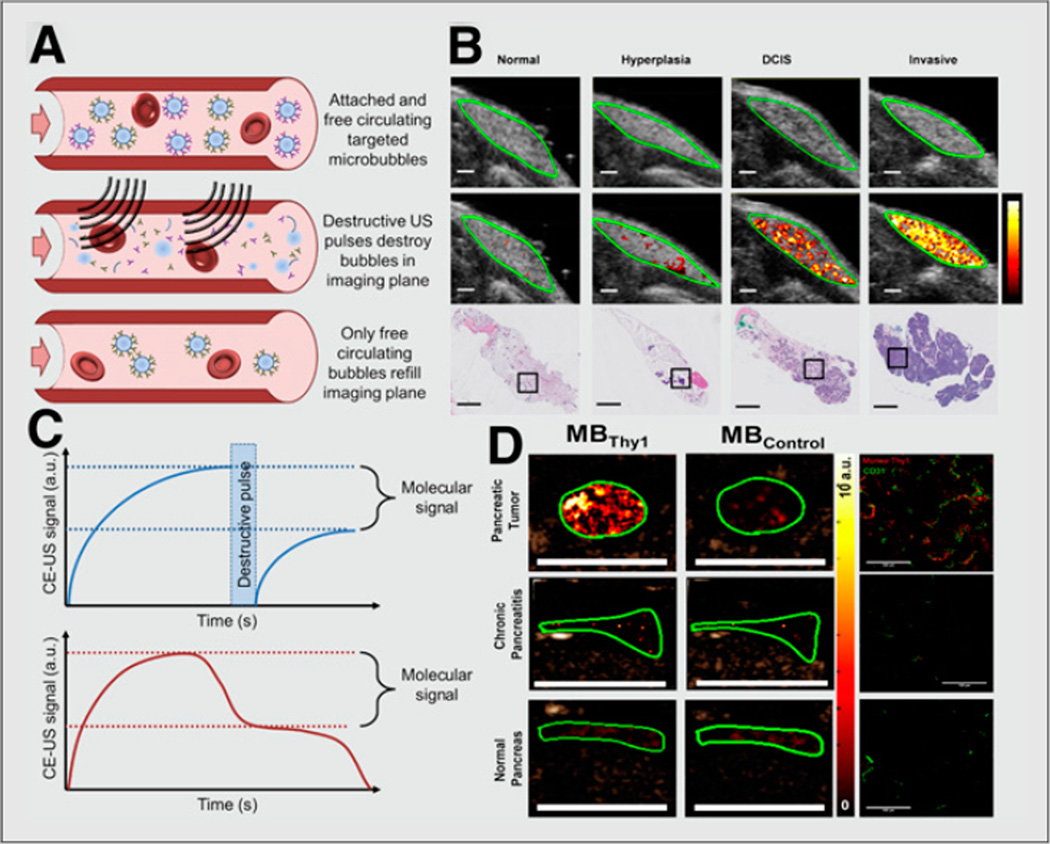
FIGURE 1. Ultrasound molecular imaging of cancer.
(A) Schematic showing quantification of ultrasound molecular imaging signal using molecularly targeted contrast microbubbles. (Top) First, microbubbles attach to targets on vascular surface, and signal amplitude is recorded. (Middle) Next, ultrasound pulses are applied to destroy microbubbles within imaging plane. (Bottom) Finally, free circulating microbubbles perfuse into imaging plane and signal amplitude is again recorded. (B) Molecular ultrasound images using clinical-grade human vascular endothelial growth factor receptor 2 (kinase insert domain receptor)–targeted contrast microbubble in transgenic breast cancer mouse model showing increased signal as tissues progress from normal to hyperplasia, ductal carcinoma in situ, and invasive breast cancer (11). (C, top) Difference in pre- and postdestruction images corresponds to signal from attached microbubbles. (C, bottom) Alternative method for determining molecular signal involves waiting (e.g., 10 min after intravenous injection of microbubbles) to allow clearance of freely circulating microbubbles and measuring steady-state signal corresponding to microbubbles attached to molecular targets. (D) Ultrasound molecular image of 4-mm tumor in transgenic pancreatic cancer mouse model using microbubbles targeted at Thy-1 (novel pancreatic cancer target) compared with normal pancreas and chronic pancreatitis tissues (13). a.u. = arbitrary unit; CE-US = contrast-enhanced ultrasound; DCIS = ductal carcinoma in situ; MBThy1 = microbubbles targeted at Thy-1; MBControl = microbubbles targeted at control tissues. (B and D reproduced with permission of (11,13).)

