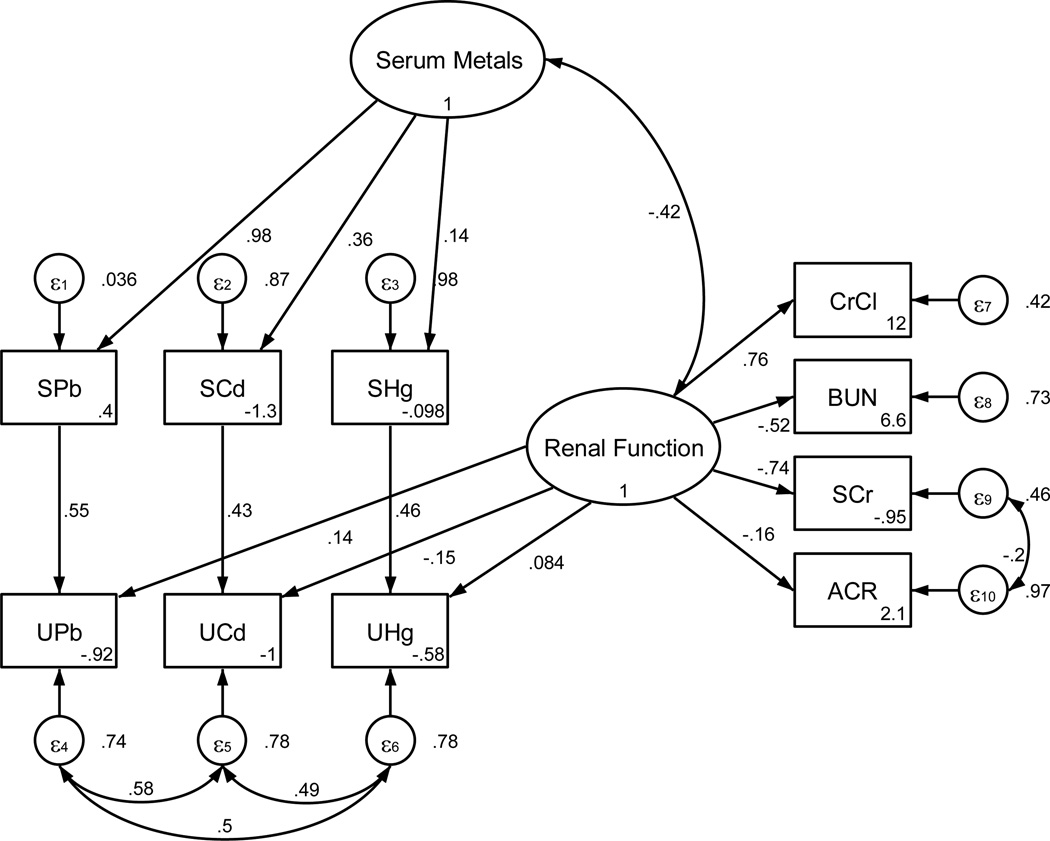
Figure 1.
Structural equation model of the interaction of serum and urine metals on human renal function. Ovals represent unobserved or latent factors. Rectangles represent observed or measured variables. Single arrows represent the direct influence of one variable upon another, while dual-head arrows represent covariance. Standardized path coefficients are indicated by the numbers next to the arrows and represent the correlation or strength of the relationship between factors. Negative coefficients indicate inverse relationships between the variables, while positive coefficients indicate direct positive relationships. Small circles labeled ε1 – ε10 represent unexplained or residual variance in each observed variable the value of which is listed to their right of each in the diagram. Equation intercepts are listed in the lower right of each rectangle. Correlations between measurement errors of SCr and ACR, as well as among UPb, UCd, and UHg were added during model refinement. Correlations among the measurement errors of all of the urine metal concentrations may indicate that some other common factor, besides serum concentrations or Renal Function, accounts for a portion of their variance. This could occur if another aspect or factor affects their renal elimination but is not adequately measured by the four indices of kidney function included in this model.

