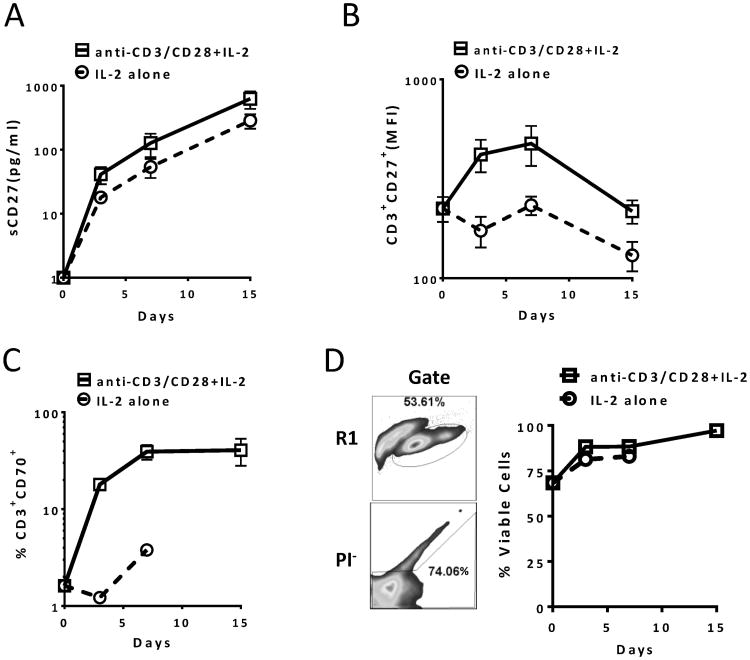
Figure 1.
sCD27 production is associated with T-cell activation in vitro. (A) Increased sCD27 in culture supernatant from PBMCs stimulated in vitro with anti-CD3/CD28 and IL-2. Eight PBMC samples (106 cells/ml) from healthy donors were stimulated with or without anti-CD3/CD28 beads (1:1 cell-to-bead ratio) in the presence of 10 U/ml of IL-2 for 15 days. Supernatant was collected on days 3, 7, and 15. On day 7, three of the activated PBMC samples were split and fresh medium was added due to cell overgrowth, and the dilution factor was considered when calculating the values. For day 0 sCD27 values, the analysis was done using culture medium without adding serum. The level of sCD27 was tested by ELISA, and for better data presentation, the values of sCD27 are shown in log10(y+1). A repeated measures ANOVA was performed on transformed data and orthogonal contrasts were used to test for linear trends on days 3-15 data only. (B) Expression of surface CD27 on T cells with or without stimulation. The cells described above were analyzed by FACS, and CD27 expression was measured by MFI of CD27 on CD3+ and propidium iodide negative (PI-) cell populations. The Y-axis is shown in log10(y). A repeated measures ANOVA was performed on transformed data and pair-wise p-values were adjusted using Holm's method. (C) CD70-expressing T-cell population in PBMCs with or without stimulation. FACS analysis was also done on days 0, 3, 7 and 15 for the cells described in (A) by examining the frequency of the CD3+CD70+ T-cell population in anti-CD3/CD28 and/or IL-2 stimulated PBMCs. A repeated measures ANOVA was performed on transformed data and pair-wise p-values were adjusted using Holm's method. The Y-axis is shown in log10(y). (D) No significant cell death after activation with anti-CD3/CD28 beads. The experiment described in (A) was also analyzed for viability after the activation by staining the cells with PI. An example of lymphocyte (R1) and PI negative cell gates is indicated on the left and % of PI negative cell population from 10 PBMCs is shown on the right. There were no data acquired for day 15 in the IL-2 alone group in (C) and (D). Data are presented as means ± SEM. MFI, mean fluorescence intensity.

