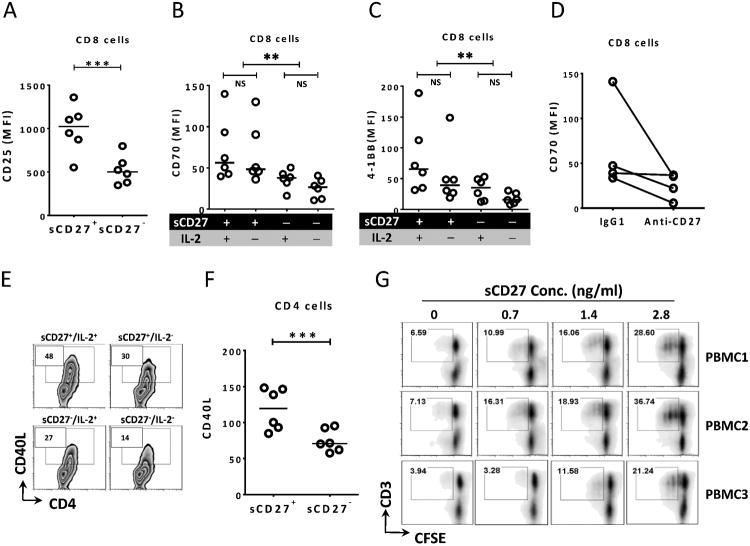
Figure 3.
sCD27 up-regulates the expression of activation markers on T cells and promotes T-cell proliferation in vitro. (A) sCD27 up-regulated surface expression of the activation marker CD25 on CD8+ T cells (p < 0.0005). Six PBMC samples were stimulated with anti-CD3/CD28 beads in the presence or absence of sCD27 (1.4 ng/ml). Three days after stimulation, FACS analysis was performed by analyzing CD25 on CD8+ T cells. A one-way repeated measures ANOVA was performed on the raw data. (B and C) sCD27 also up-regulated expression of the activation markers CD70 and 4-1BB. A two-factor factorial [sCD27 (+ or −), IL-2 (+ or −)] repeated measures ANOVA on log10(y) transformed data was performed, and Holm's methods were used to adjust p-values. When the effects of sCD27 and IL-2 on CD70 and 4-1BB expression were compared, the analysis showed that sCD27 enhanced CD70 and 4-1BB expression on CD8+ T cells (p < 0.001 and p < 0.005, respectively), pooled over IL-2. (D) Depletion of sCD27 showed a trend of decrease in T-cell activation by measuring CD70 expression on CD8+ T cells. Four PBMC samples were stimulated with anti-CD3/CD28 beads in the presence of supernatant in which sCD27 was not depleted (sCD27 value = 1.4 ng/ml, IgG1) or was depleted (sCD27 value = 0 pg/ml, anti-CD27) using anti-CD27 antibody. Four days later, surface expression of CD70 on CD8+ T cells was analyzed by FACS. A one-way repeated measures ANOVA was performed on transformed data, p = 0.093. (E and F) Cells from the experiment described in (A) were also evaluated for CD40 ligand (CD40L) surface expression on CD4+ T cells by FACS analysis. sCD27 enhanced CD40L expression on CD4+ T cells measured as the percent of positive cells (panel E) or MFI (panel F). A one-way repeated measures ANOVA was performed on the raw data. (G) sCD27 promotes T-cell proliferation in vitro. Six PBMC samples from healthy donors (106 cells/ml) were labeled with CFSE and then stimulated with anti-CD3/CD28 beads at a low (1:5) bead to cell ratio in the presence of different concentrations of purified recombinant sCD27 and IL-2 (10 U/ml). The CFSE dilution was analyzed by FACS on day 5 after stimulation, and CD3+CFSE− cells were gated. Results from three of six PMBC samples are shown. Lines in the dot plot graphs indicate the median values. **p < 0.01; ***p < 0.001. MFI, mean fluorescence intensity.

