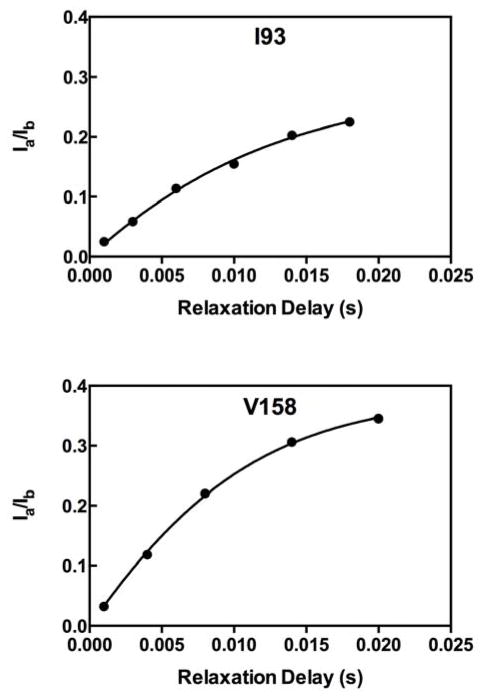
Figure 1.
1H-1H dipolar cross-correlated relaxation data for IGPS. The ratio of peak intensities for I93 in Apo IGPS and V158 in acivicin bound IGPS are presented with the solid line being the fit of equation (5) to the data points. Data were acquired at 14.1 T, pH = 7.3, 303 K.

