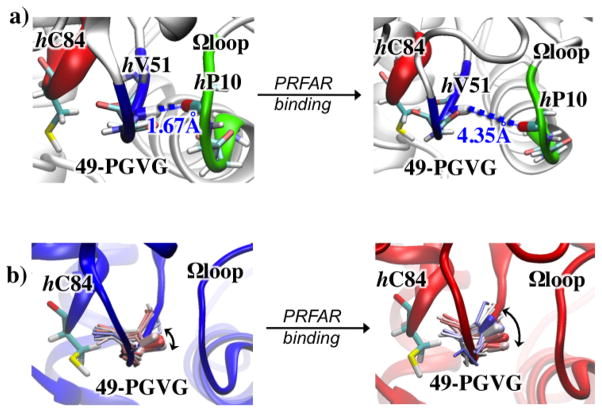
Figure 10.
MD representative snapshots (at t=50 ns) of apo (left) and PRFAR bound (right) IGPS complexes, showing H-bonds between hP10 (Ω -loop, in green) and hV51 (oxyanion strand, in blue) (panel a) and partial reorientation of the oxyanion strand triggered by PRFAR binding (panel b). Thermal fluctuations of the 49-PGVG backbone are shown (sticks colored from red to blue for 0–50 ns) highlighting the NH amide group of hV51 (larger sticks). Apo (C) and PRFAR bound (D) average structures (colored cartoons) and Gln binding site (hC84, colored sticks) are also shown. Adapted from Reference 21.

