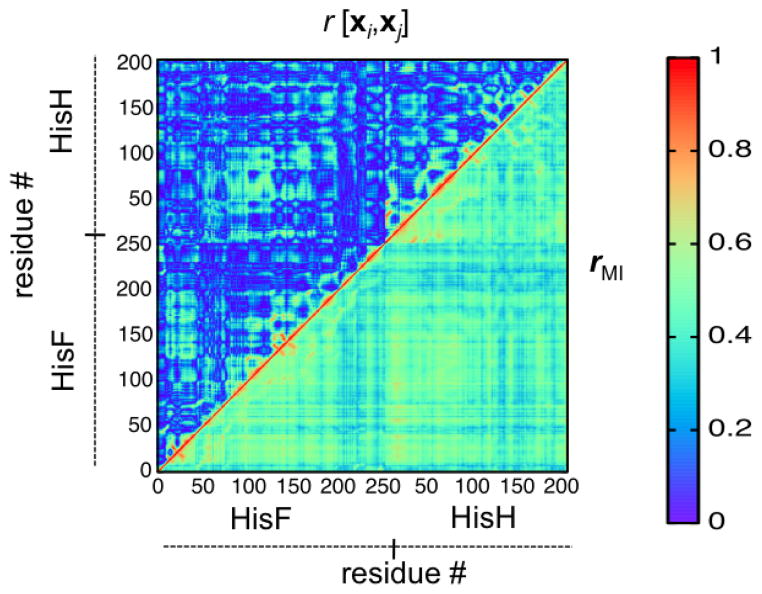
Figure 4.
Pearson coefficient r[xi, xj] (upper left triangle) and generalized correlation coefficient rMI (lower right triangle) correlation matrices for the case of the apo imidazole glycerol phosphate synthase enzyme. The same color mappings are used for a direct comparison. The rightmost color bar shows the color range for the respective correlation coefficient. Reproduced from Reference 21.

