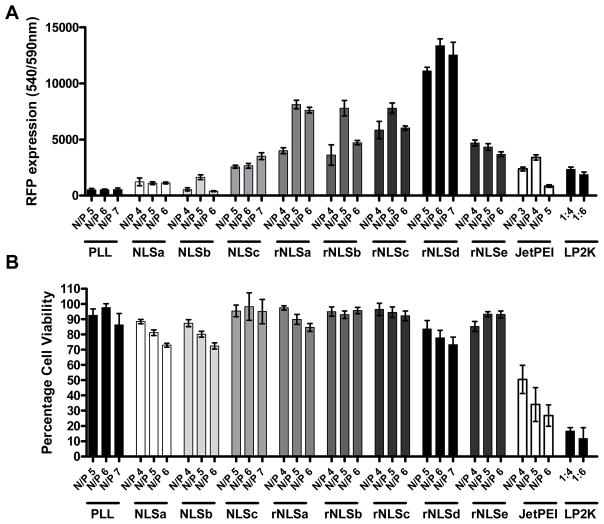
Figure 6.
Transfection performance of polyplexes in SKOV3 cells: (A) RFP expression; (B) cell viability 48 h post transfection. Cells in each well of a 96-well plate were exposed to NLSa-c or rNLSa-e polyplexes having polymer concentrations ranging from 6.24 ng/μL (for N/P 4) to 10.8 ng/μL (for N/P 7). The concentration of plasmid DNA was 2 ng/μL. Each well contained a total volume of 125 μL. Error bars indicate ± S.E.M.

