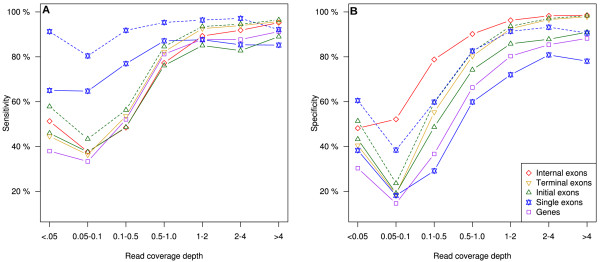
Figure 4.

Effect of read coverage depth on sensitivity (A) and specificity (B) of Neurospora crassa gene and exon prediction by SnowyOwl. Solid lines: all coordinates matched exactly; dashed lines: exon start coordinates were not required to match. Read coverage depth is the number of reads mapped to a feature divided by the feature length.
