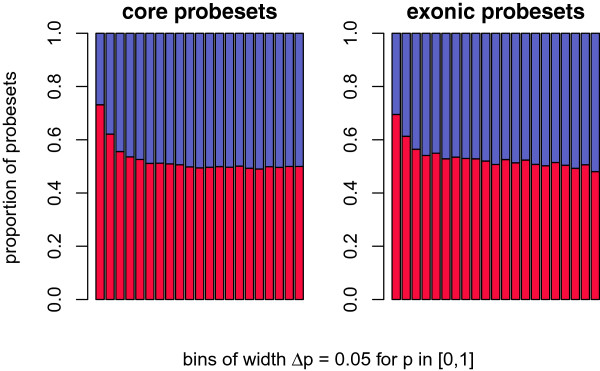
Figure 2.

Proportion of probesets indicating higher/lower inclusion in cases for binned p -value thresholds. All bins have an equal width of Δp=0.05 for p-values in the range [0,1]. Red bars symbolise the proportion of probesets indicating higher inclusion in cases; similarly, blue bars refer to lower inclusion in cases. The absolute height of a bar of each colour represents the proportion of probesets with higher/lower inclusion in cases. The t-statistic was used to determine relative inclusion: t>0 - higher inclusion in cases; t<0 - lower inclusion in cases. Plot only shows core and exonic (full) probesets.
