Figure 3.

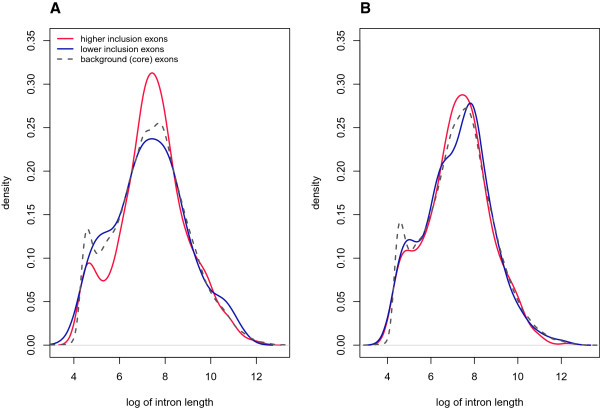
Distributions of intron length. Density plot of intron length (A) upstream and (B) downstream of differentially included exons in cases relative to controls. A similar plot for background exons (core exons) is provided for reference.

Distributions of intron length. Density plot of intron length (A) upstream and (B) downstream of differentially included exons in cases relative to controls. A similar plot for background exons (core exons) is provided for reference.