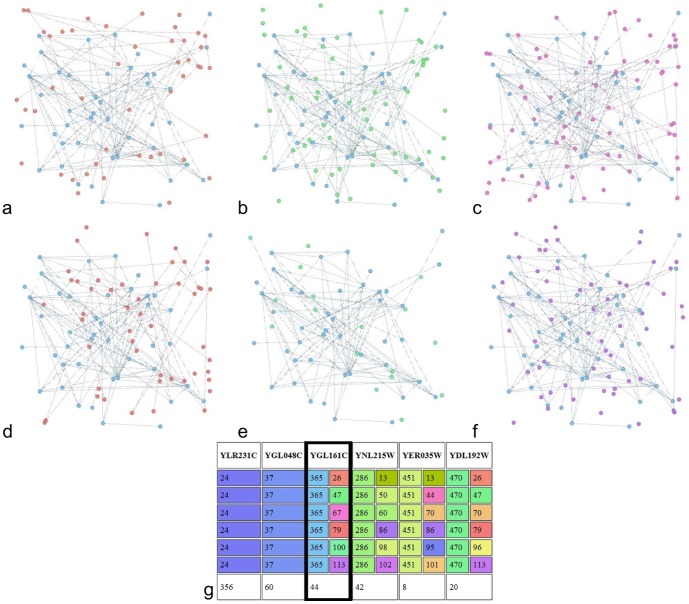
Figure 4. Sample sub-community for all 6 time steps.
a-f) Cyan coloured nodes correspond to the sub-community discovered from the set of nodes with the same community change pattern. Rest of coloured nodes are the ones belonging in the original communities, with the original colour shown. g) A sample protein belonging to the depicted community (left column) and its corresponding community pattern change (right column).

