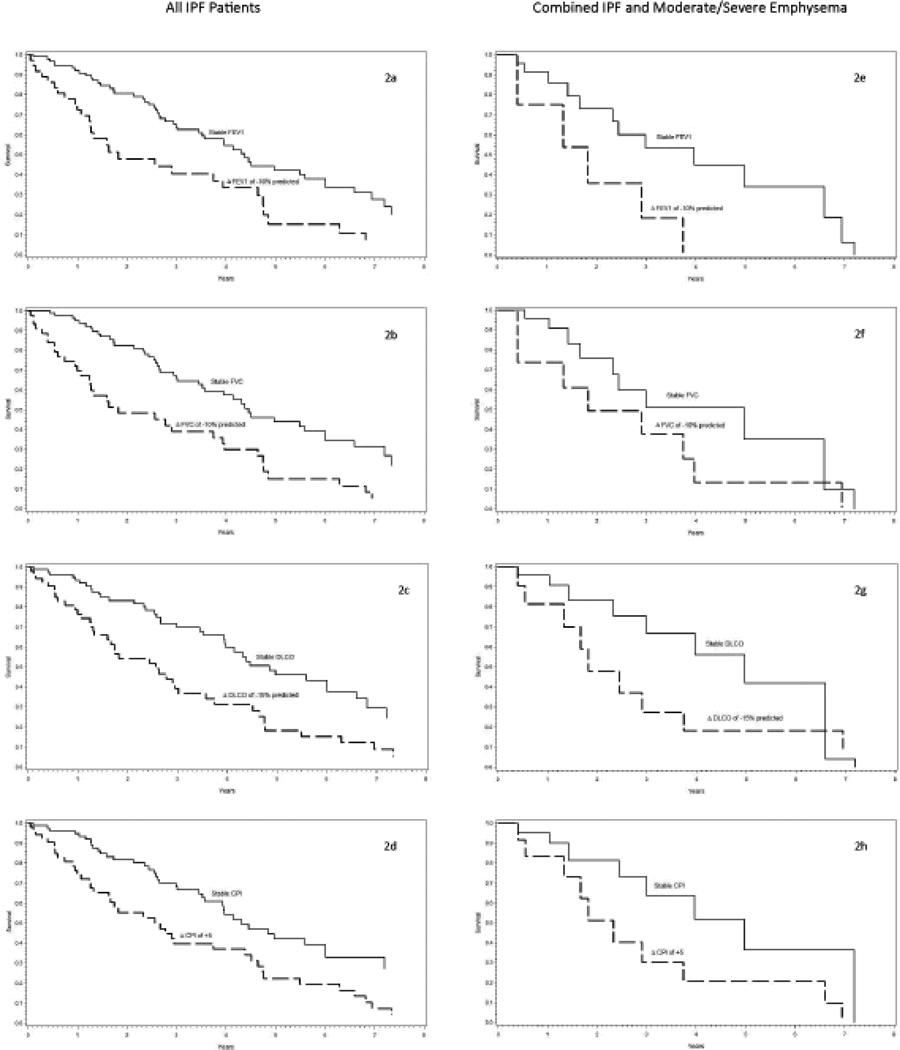
Figure 2.
Cox Model Survival† Estimates for Relevant 12 month Longitudinal Changes in Pulmonary Function Tests or Composite Physiologic Index in all patients with IPF (2a–d) and with Combined Pulmonary Fibrosis and Moderate/Severe Emphysema (2e–h). The uppermost figures, 2a and 2e, represent a relative decline in percent predicted FEV1 of greater than 10% (dashed line) versus less than 10% (solid line), followed by a relative decline in percent predicted FVC of greater than 10% (dashed line) versus less than 10% (solid line) in figures 2b and 2f. Figures 2c and 2g represent a relative decrease in percent predicted DLCO of 15% (dashed line) versus a less than 15% change (solid line). The bottom figures 2d and 2h represent an absolute CPI increase greater than 5 points (dashed line) versus less than 5 points (solid line).
Definition of abbreviations: FEV1 = forced expiratory volume in 1 second, FVC = forced vital capacity, DLCO = diffusing capacity for carbon monoxide, CPI = composite physiologic index, PFT = pulmonary function test.
† Survival is dated from the time of their last analyzed pulmonary function test, the 12 month study. Therefore, this survival applies to patients able to survive one year from their baseline study. The above physiologic cutpoints were chosen based on prior literature and the best prognostic fit according to index of concordance. All Cox models are adjusted for the baseline average PFT or CPI value, average age at diagnosis of 62, male gender and positive smoking history, with baseline hazards stratified by whether the patient was in the stable or change group.

