Fig. 5.
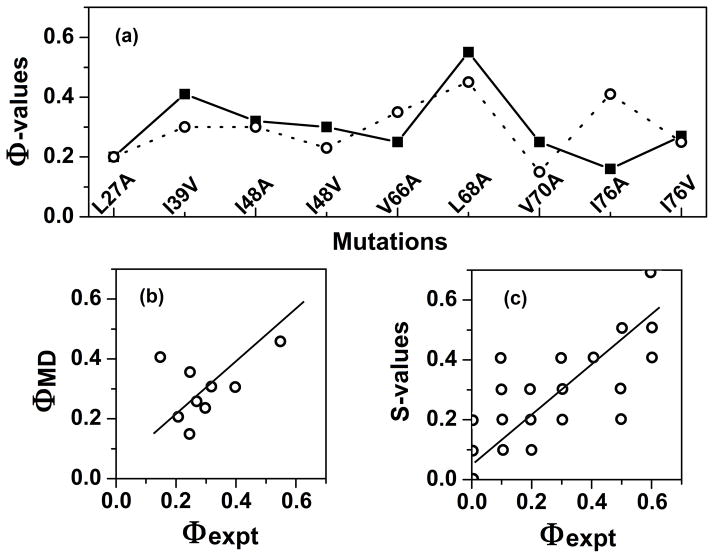
Example of Φ-value analysis. (a) Experimental (solid line) and simulated (dotted line) Φ-values [4, 21] for selected mutants of CI2. (b) Scatter plot of the points shown in panel a. (c) Scatter plot comparing experimental Φ-values and calculated average S-values, i.e. the product of local secondary structure and the amount of native-state contacts.

