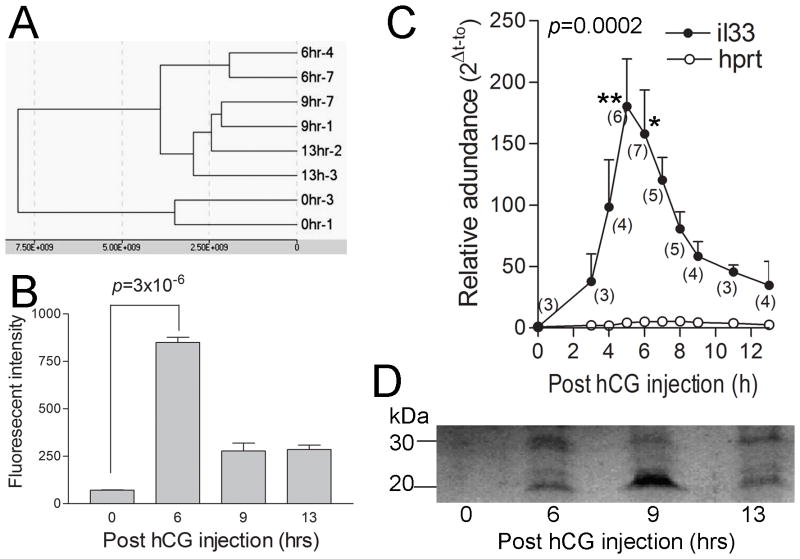
Figure 1. Ovarian IL33 expression in mice during hCG-induced ovulation.
A. Clustering analysis based on global gene expression profiles from microarray shows well clustered samples from different time points post hCG-injection. Also note that the gene expression pattern for 6 hrs is significantly different from other groups. B. Microarray shows significantly up-regulated ovarian IL33 expression at 6 hrs post-hCG injection as compared to 0 hr. Expression levels were expressed as fluorescent intensity. C. Quantitative PCR detection of IL33 mRNA revealed a transient up-regulation of IL33 expression during 3 to 9 hr. A house keeper gene hprt was used as control. The number of samples at each time point is indicated in parenthesis. Kruskal-Wallis test was applied; data for each time point was compared to that for 0h with Dunn’s post test. D. Western blot detection of two forms of IL33 (30kD for nuclear form and 20kD for cleaved form) at time point as indicated. Note a higher level of cytokine form of IL33 at 9 hrs. This represents similar results from 3 independent experiments.

