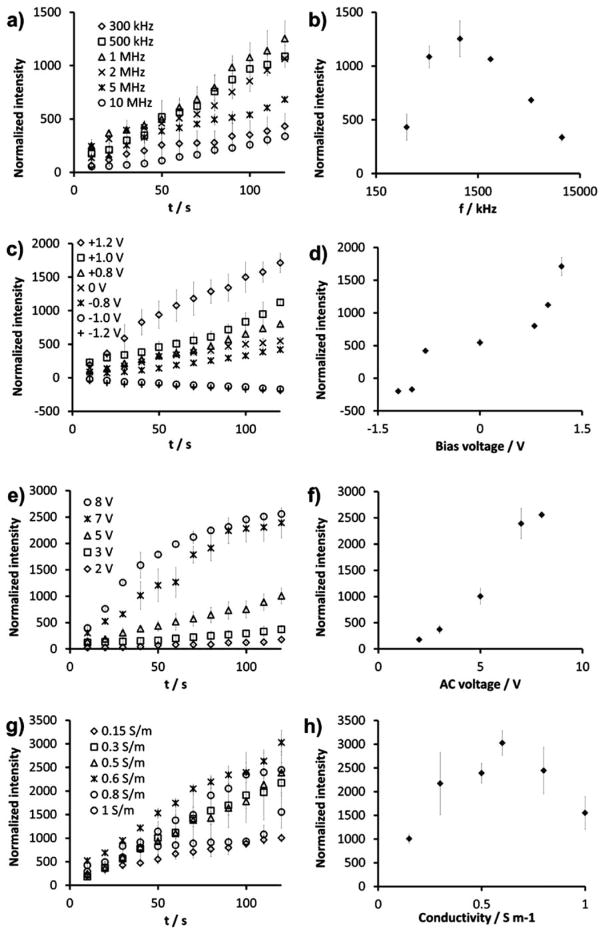
Fig. 2.
(a,c,e,g) Dependence of the concentration effects on the applied frequency (a), DC offset (c), AC voltage (e), and buffer conductivity (g). (b,d,f,h) Intensity values after 120 s. The intensity values are normalized by the initial value. Unless specified otherwise, the applied frequency, DC offset, AC voltage and conductivity are 1 MHz, 1 V, 5 V. and 0.15 S m−1, respectively.

