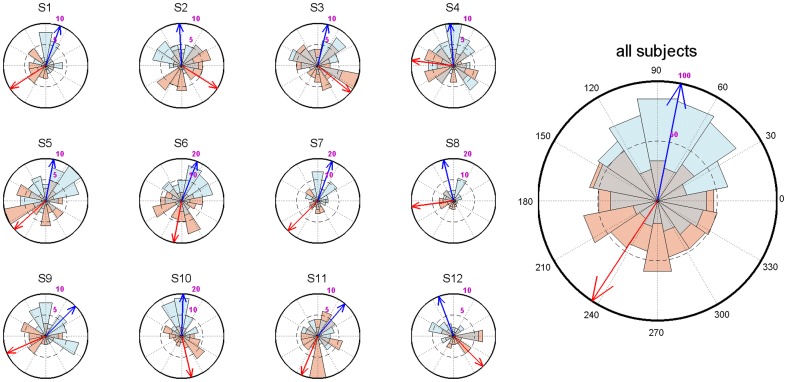
Figure 1. Circular histograms showing algorithm performance for up- (blue) and down-targeted (red) sound stimuli, both within single subjects and across all trials (right).
Arrows indicate average phase angle; 90 degrees corresponds to the peak of the up state, 270 degrees to the trough of the down state.

