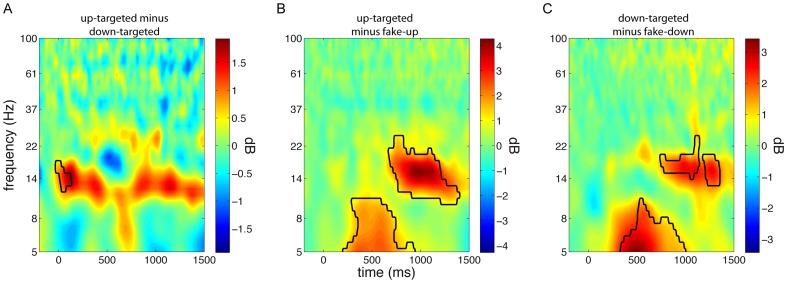
Figure 3. Time-frequency power difference plots for frontal electrode Fz.
Conceptually, panels A-C are similar to Figure 2 A-C. (A) Up-targeted minus down-targeted sound presentation reveals an early enhancement in spindle power in the up state. (B) Up-targeted stimulus delivery compared with fake-up events results in an initial theta response, followed by a later spindle/beta response. (C) Similarly, down-targeted sounds elicit theta and spindle/beta activity relative to fake-down events.

