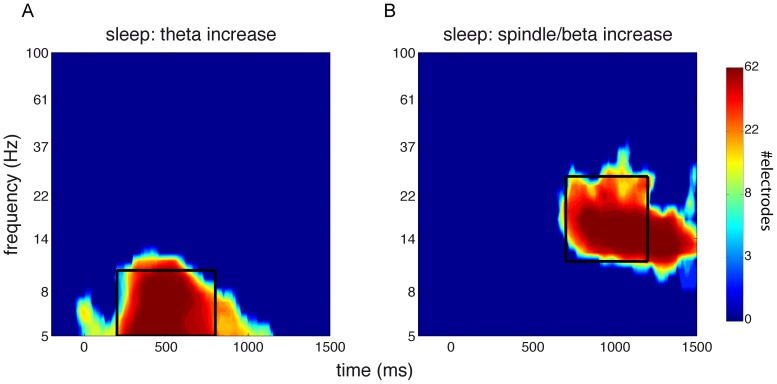
Figure 5. Heat maps of clusters showing significantly elevated power relative to baseline.
Indicated is the number of channels involved at each time-frequency point. Black box indicates window of interest used for averaging. (A) Cluster showing extent of early theta response. Window from 5–10 Hz, and 200–800 ms. (B) Cluster showing extent of late spindle/beta response. Window from 11–27 Hz, and 700–1200 ms.

