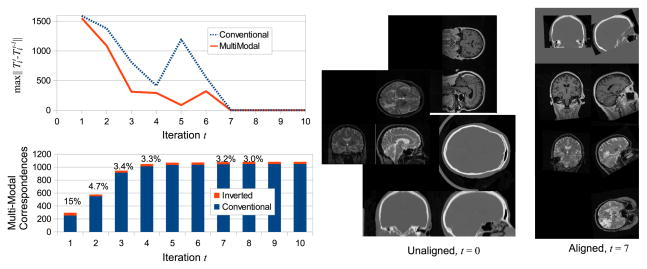
Fig. 2.
The upper left graph illustrates transform set T̄ change vs. iteration t, where change is measured by the maximum Frobenius norm affine transform matrix difference . Learning converges after 7 iterations, after which T̄ does not change. The lower left graph shows the relative numbers of conventional and inverted correspondences over iteration t, where the percentages reflect the proportion of inverted correspondences. Image sets to the right show images before alignment t = 0 and resampled after convergence according to Ti at t = 7. Note the slightly elevated orientation in aligned images; since alignment here is fully automatic, the final geometry of group-wise alignment is determined by the data.

