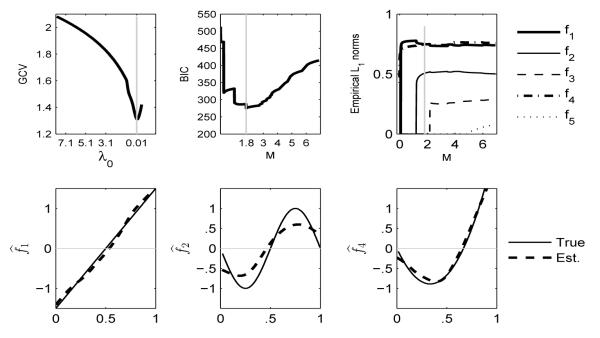
Fig. 1.
The plots of component selection and estimation results from one simulation. Top Left: GCV vs. λ0. Top middle: BIC vs. M. Top right: empirical L1 norms at different M values. The gray vertical bars in the top panels indicate the tuning parameters chosen. The three bottom panels show the estimated fk’s (dashed line) vs. the true (solid line), for k = 1, 2, 4.

