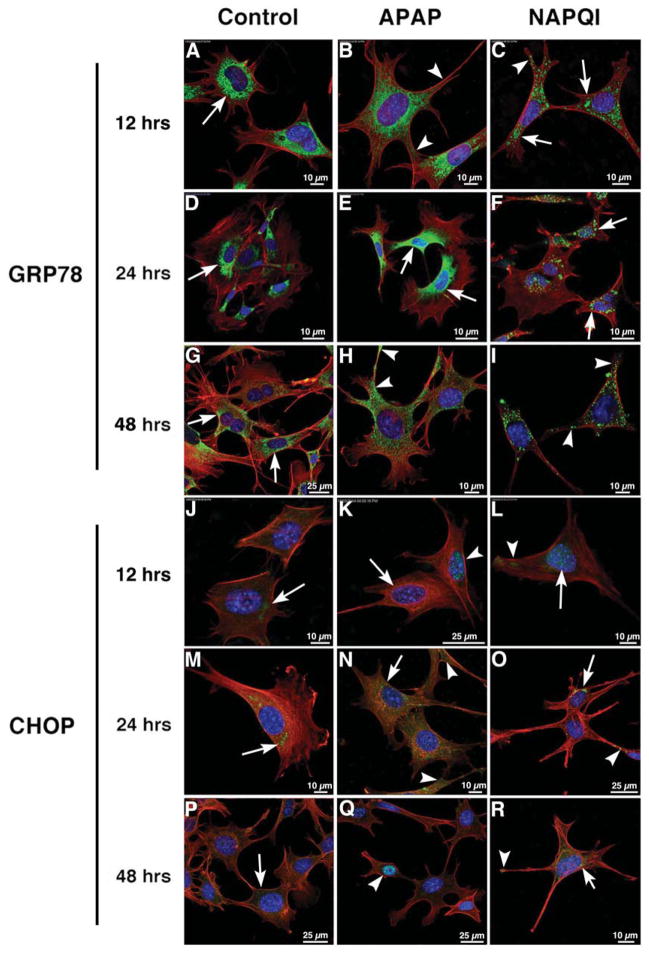
Fig. 3. The cytotoxic effects of APAP and NAPQI on HEI-OC1 cells involves ERS.
Confocal microscopy using antibodies against ERS markers GRP78 (green, A–I) and CHOP (green, J–R) at 12, 24 and 48 h. In all panels red color corresponds to rhodamine phalloidin and blue to DAPI. In Control and APAP-treated cells GRP78 immunolabeling at 12 and 24 h. was mostly perinuclear and homogeneous, although at 12 h reactivity was more extended in APAP-treated cells (B, arrowheads); in NAPQI-treated cells immunolabeling was coarse and cluster-like, with a perinuclear distribution at 24 h (F, arrows), but also present in cellular projections at 12 h (C, arrowheads). At 48 h it was still perinuclear in Control cells (G, arrows), but it was also detected in filopodia and other cellular projections in APAP- and NAPQI-treated cells (H–I, arrowheads). CHOP immunoreactivity was weaker than GRP78. At 12 h a diffuse labeling was observed in the perinuclear region of Control cells (J, arrow), whereas in APAP-treated cells the nucleus of some cells were clearly immunoreactive (K, arrowhead) but not others (K, arrow); a faint labeling was observed in the nucleus and cytoplasm of in NAPQI-treated cells (L, arrow and arrowhead). At 24 h immunolabeling was more evident in all the conditions, with well defined spots of immunoreactivity in the perinuclear region (arrows) and cell periphery (arrowheads) (panels M–O). At 48 h cells’ labeling was more similar to that at 12 h than at 24 h, with a faint cytoplasmic labeling in Control cells (P, arrow), nuclear reactivity in some APAP-treated cells (Q, arrow), and NAPQI-treated cells showing CHOP immunoreactivity both in the perinuclear region (arrow) and cell periphery (arrowhead) (panel R).

