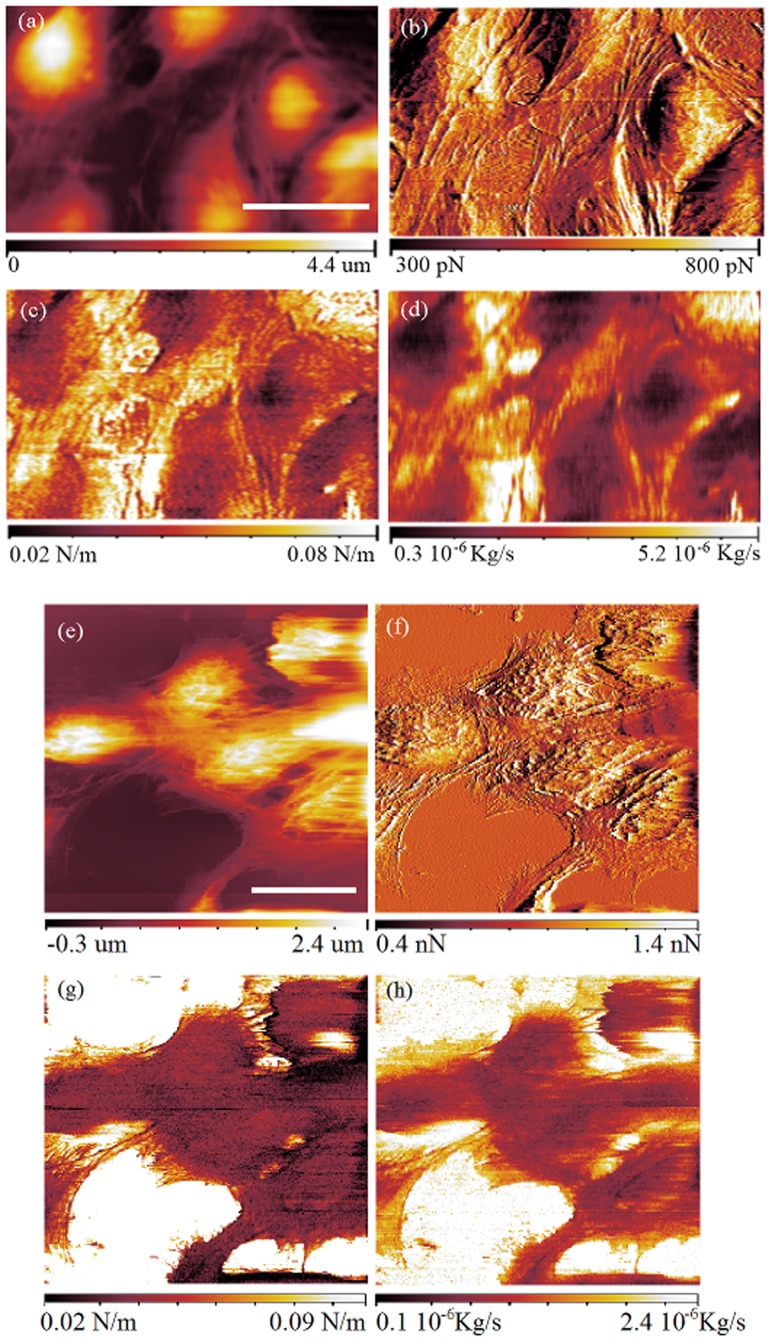
Figure 4. FFM images of PC12 living cells acquired at a constant force of 500 pN and 1 nN.
In the images at 500 pN constant force (a,b,c,d) the scale bar is 30  a) Sample topography, b) force between the tip and the sample (error), c) force gradient and d) damping factor. In the images at 1 nN (e,f,g,h), the scale bar (a,e) is 30
  e) Sample topography, f) force (error), g) force gradient and h) damping factor.

