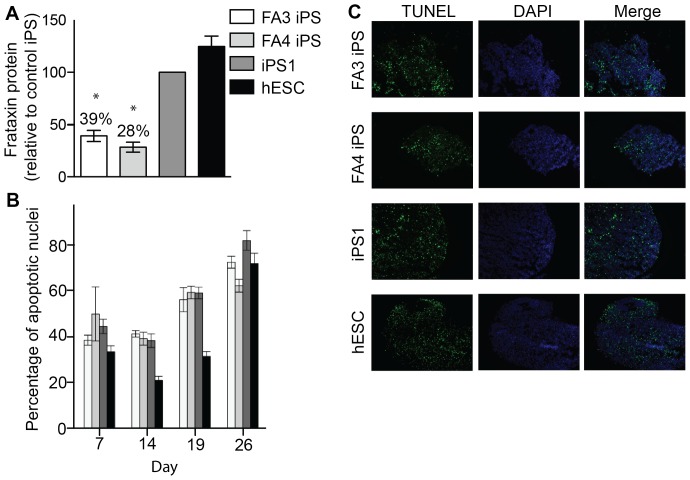
Figure 3. Frataxin expression and level of cell death in neurospheres derived from FA iPS cells.
(A) Frataxin protein was measured in cell lysates using immuno-capture dipsticks and quantified relative to the control iPS line. N = 3 experiments, with at least 12 neurospheres per sample for each replicate experiment (B) Levels of cell death in neurospheres cultured for 7–26 days were determined by percentage of TUNEL expression. (C) Representative TUNEL staining images from day 26. N = 3 separate experiments per time point, with at least 5 neurospheres per time point for each experiment. *p<0.001. Error bars where shown = SEM.

