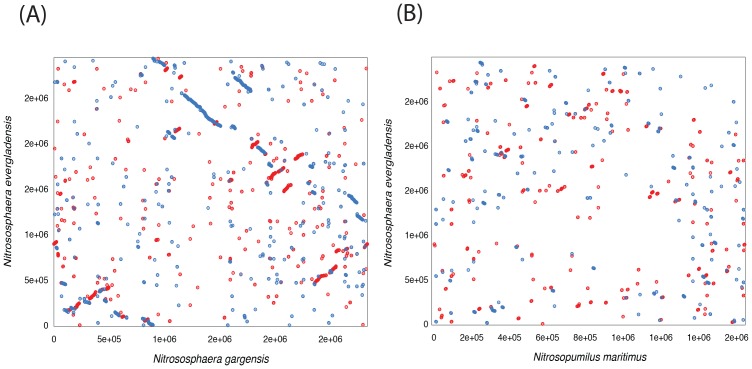
Figure 4. Genome synteny alignments of Ca. N. evergladensis, (A) Ca. N. gargensis and (B) N. maritimus.
Axes X and Y represent topology of coding sequences in the comparing genomes. Entire genomes were compared by MUMmer 3.0 package using Promer tool [114]. Each dot represents a match of at least six amino acids from compared genomes. Forward matching amino acid sequences are plotted as red lines/dots while reverse are plotted as blue lines/dots. A line of dots with slope = 1 represents an undisturbed segment of conservation between the two sequences, while a line of slope = −1 represents an inverted segment of conservation between the two sequences.

