
Fig. 2.
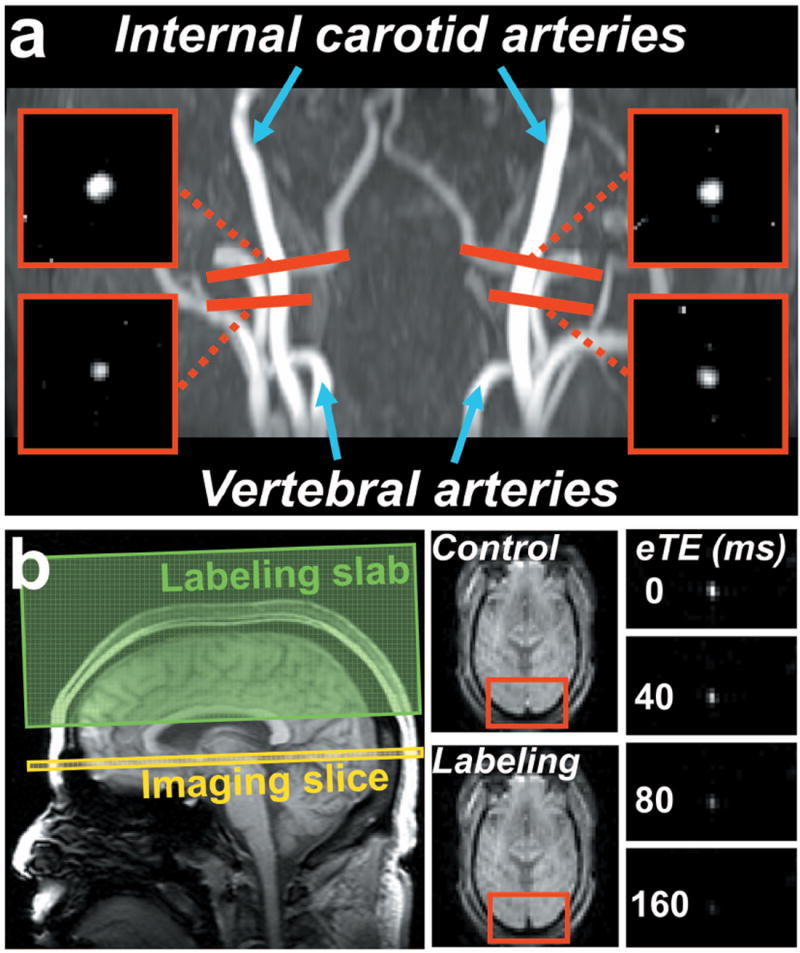
MR images of the CMRO2 measurement from a representative subject. (a) Positioning and the resulted phase-contrast (PC) images of the four feeding arteries of the brain, i.e., left and right internal carotid arteries, and left and right vertebral arteries. The four PC MRI scans (red bars) are positioned perpendicular to the respective feeding arteries. (b) Positioning and the resulted TRUST images. The imaging slice (yellow box) was positioned to be perpendicular to the superior sagittal sinus. The TRUST technique utilizes the spin-tagging principle with the labeling slab (green box) on the venous side (above the imaging slice). Subtraction of the control and labeled images yields pure blood signal in sagittal sinus, which is then subject to increasing T2 weightings. The monoexponential fitting of the blood signal to the T2-preparation duration (termed effective echo time [eTE]) then gives the T2 value of the venous blood. As blood T2 has a well-known relationship with the oxygenation level of the blood, the estimated venous T2 can be converted to Yv.