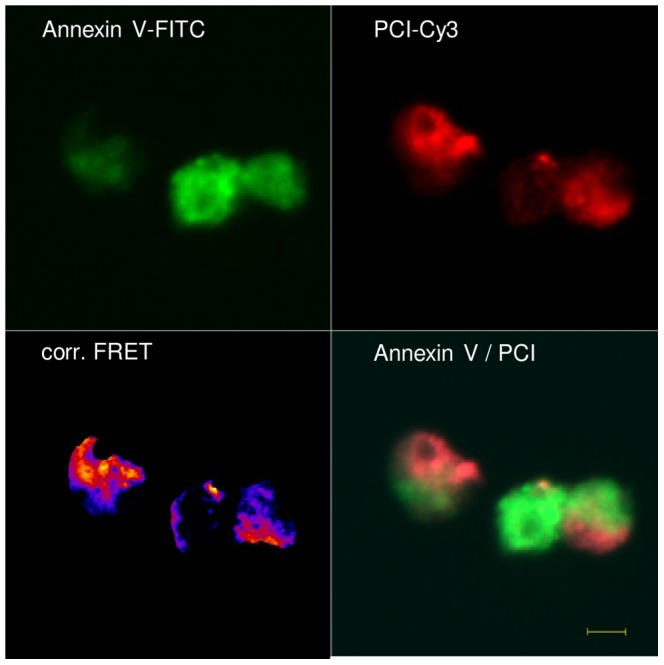
Figure 4. Colocalization of PCI-Cy3 and Annexin V-FITC on Ct-Jurkat cells.

Ct treated Jurkat cells were incubated with 250-Cy 3 and 75 nM Annexin V-FITC and analysed for FRET signal. Calculations and corrected pictures (fire) were processed with ImageJ software using the PixFRET software as described in “Materials and Methods”, signal intensity is indicated by the color spectrum displaying intense signals in yellow. The figure shows representative pictures of two independent experiments. The scale bar shows the length of 5µm (40×, n.a. 1.3 oil objective).
