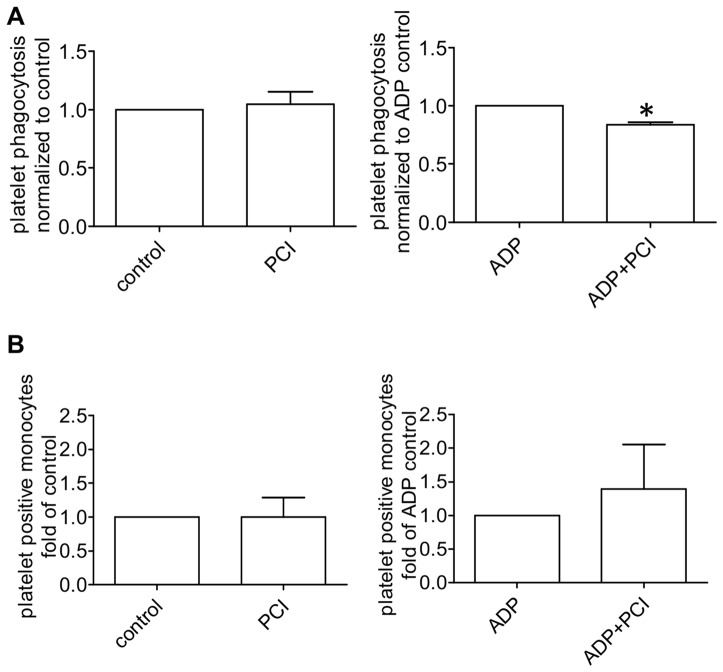
Figure 6. Phagocytosis of untreated and activated platelets.
The graphs (A) represent phagocytosis and (B) shows surface binding of untreated and ADP (20µM) activated platelets by human blood derived monocytes with or without 300 nM PCI. Platelets were stained with CMFDA, activated with ADP and phagocytosis was conducted with monocytes for 60 minutes. Surface bound platelets, detected by CD61-Alexa647 were substracted from the total monocyte associated platelets to gain the count of phagocytosis. The bar graphs represent mean and standard deviation of 5 experiments, each performed in duplicates. Statistical significance was calculated with the two tailed paired Student's T-test,* = P<0.05.

