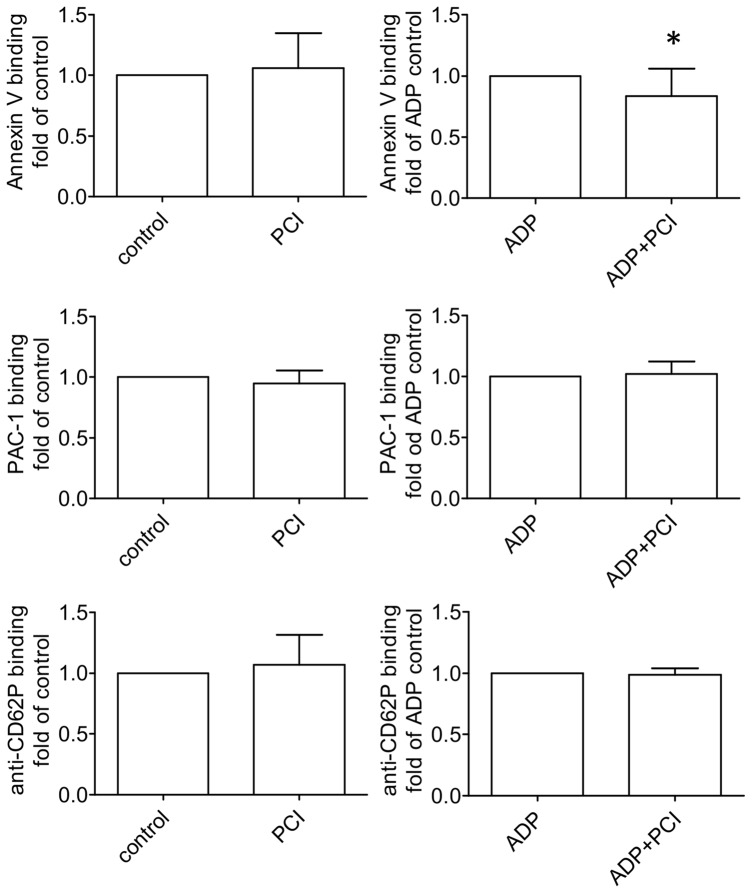
Figure 7. Surface markers of activated platelets.
The graphs show the influence of PCI on platelet activation. Platelets were incubated with 300-FITC to detect PS surface exposure (n = 15), PAC-1 antibody to determine GPIIb/IIIa activation (n = 10) and anti-CD62P-Alexa647 for surface expression of P-selectin (n = 10). Bar graphs represent mean and standard deviation. Statistical significance was calculated with the two tailed paired Student's T-test, * = P<0.05.

