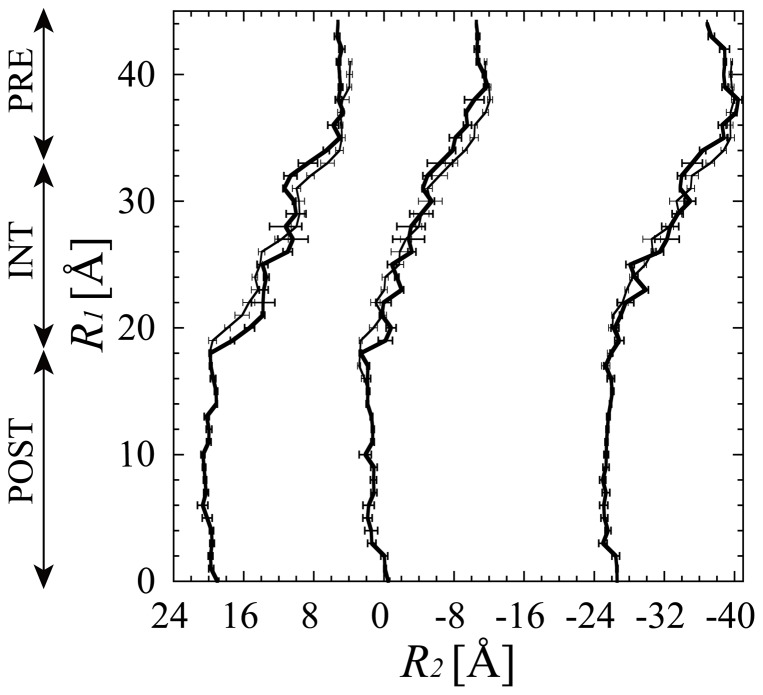
Figure 3. The movements of the P-tRNA, E-tRNA and EF-G.
(a) The paths of the centers of mass of the anticodons of the P-tRNA and E-tRNA, and of domain IV (residues 481–603 and the C-terminal region 675–690) of EF-G, the second reaction coordinates of R2, are plotted against R1. The paths obtained from the first and second “r-translocation” simulations are plotted with thick and thin lines, respectively.

