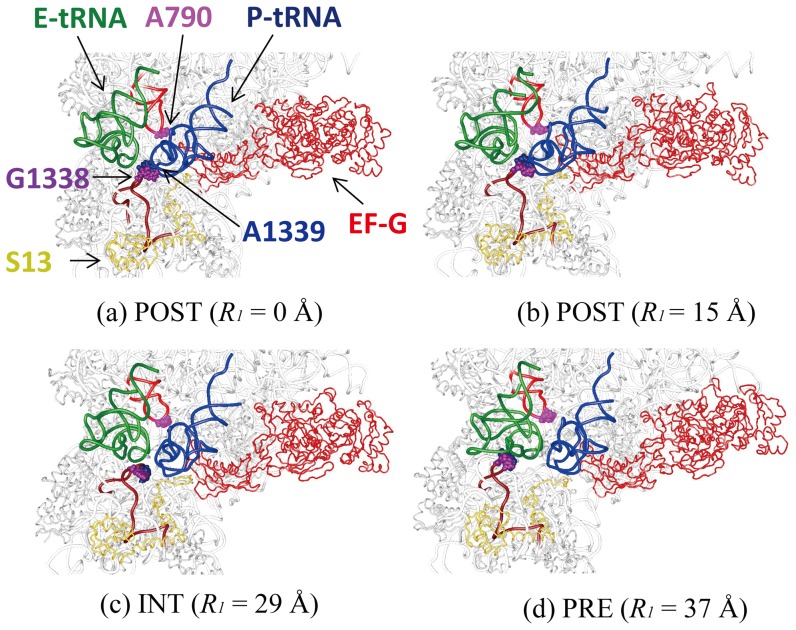
Figure 5. Conformational changes around the P/E-gate and the tRNAs in the POST, INT and PRE states.
Snapshots of the conformations around the P/E-gate and the tRNAs on the small subunit in the (a) POST (R1 = 0 Å), (b) POST (R1 = 15 Å), (c) INT (R1 = 29 Å) and (d) PRE (R1 = 37 Å) states in the first “r-translocation” simulation are shown. The atoms of G1338, A1339 and A790, of the P/E-gate are depicted as space-filling models in purple, dark blue and pink, respectively. The loop regions of the 16S nucleotides A780-G799 and C1328-G1347 are depicted as wire models in red and brown, respectively. Protein S13 is also shown in yellow as a reference.

